Examining the effect of User Experience on Generation Y and Z Customers’ Satisfaction and Loyalty in Jago Syariah mobile banking
DOI:
https://doi.org/10.29244/hass.2.2.31-36Keywords:
Customer loyalty, Customer satisfaction, Jago Syariah, Mobile banking, User experienceAbstract
The rapid expansion of internet access and the growth of Indonesia’s digital economy have accelerated the adoption of digital financial services, particularly mobile banking. In this increasingly competitive environment, Islamic digital banking providers face a dual challenge: ensuring Sharia compliance while delivering a seamless user experience (UX) that meets modern customer expectations. This study examines the effect of UX on Customer Satisfaction (CS) and Customer Loyalty (CL) among Generation Y and Z users of Jago Syariah mobile banking in Jabodetabek. A quantitative design was employed using an online survey (May–June 2025) with purposive sampling, yielding 203 valid responses from active users aged 17–44. UX was measured using the User Experience Questionnaire (UEQ) with six dimensions (attractiveness, perspicuity, efficiency, dependability, stimulation, and novelty), while CS and CL were assessed using established indicators. Data were analyzed through descriptive statistics and Partial Least Squares Structural Equation Modeling (PLS-SEM) using SmartPLS 4. The measurement model met validity and reliability criteria (AVE > 0.50; HTMT < 0.90; CR > 0.70). Structural results showed that UX positively and significantly influenced CS (β = 0.817; t = 21.176) and CL (β = 0.498; t = 6.716), and CS also positively affected CL (β = 0.443; t = 5.529), confirming the mediating role of satisfaction. The model explained 66.5% of variance in CS and 80.3% in CL. These findings highlight UX as a critical driver of satisfaction and loyalty in Islamic mobile banking, emphasizing the need for continuous improvements in usability, reliability, and feature performance to sustain customer retention and advocacy among digitally literate generations.
1. Introduction
The global acceleration of digital transformation is reflected in the rapid expansion of internet access and the increasing integration of digital technologies into everyday life. The 2024 report by We Are Social and Hootsuite showed that more than 66% of the world’s population, approximately 5.35 billion people, was connected to the internet. This growth has been driven by improvements in digital infrastructure, widespread smartphone adoption, and the expansion of the service ecosystems across communication, commerce, education, and finance. Therefore, Internet access has become a fundamental enabler of economic activity and service delivery in modern societies (Archer & Wildman, 2020). A similar pattern is evident in Indonesia, where internet penetration continues to increase steadily. According to the Indonesian Internet Service Providers Association (A.P.J.I.I., 2024), 221.56 million Indonesians, or 79.5% of the population, were internet users in 2024, representing a year-on-year increase of 1.4%. This development reflects sustained investment in telecommunications infrastructure and the increasing reliance on digital platforms for daily activities. Rising internet adoption has created favorable conditions for the expansion of digital-based services, including financial services, which are increasingly embedded in the everyday lives of
consumers.
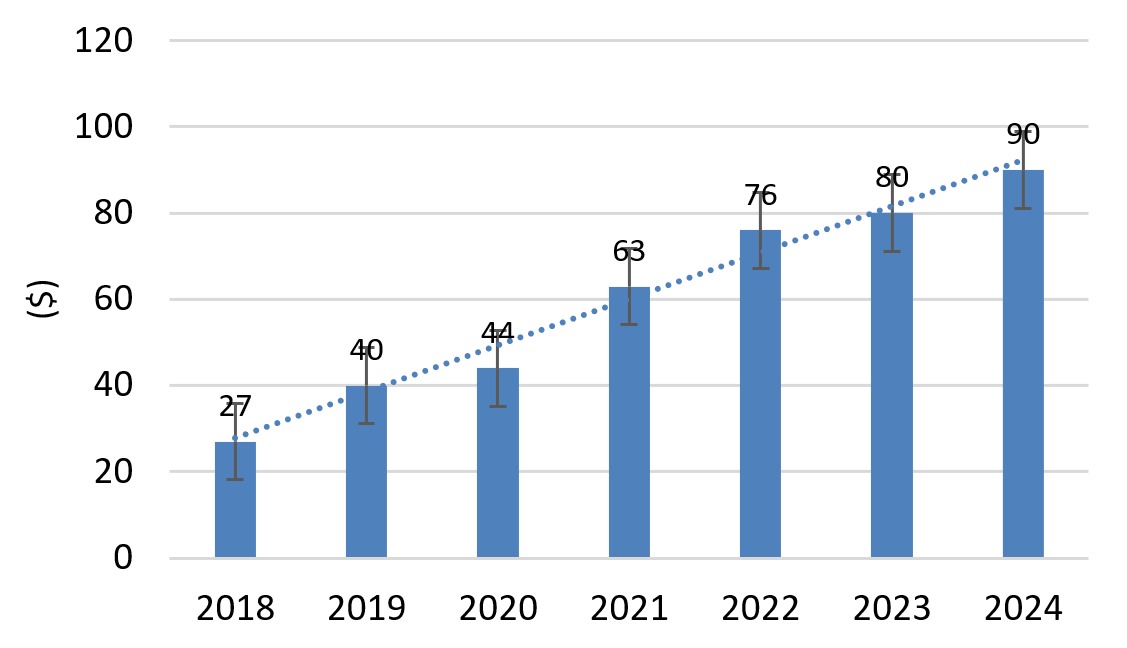
Alongside increasing internet penetration, Indonesia’s digital economy has experienced rapid growth. Data from e-Conomy SEA 2024 showed that GMV reached US$90 billion in 2024, confirming the country’s position as the largest digital economy in Southeast Asia. Even though the growth spans multiple sectors, the relevance to this research is in the accelerated adoption of digital financial services, particularly mobile banking. The expansion of digital finance shows a structural shift in consumer interaction with financial institutions, placing greater emphasis on speed, convenience, and service quality (Kozhushko, 2023).
The banking sector has been among the fastest to adopt digital technologies, and Indonesia has experienced a sharp acceleration in the use of digital banking. Bank Indonesia reported that digital banking
transaction values reached IDR 7,492.93 trillion in September 2024, growing by 54.89% year-on-year, whereas transaction volumes increased by more than 40% (News, 2024). This trend confirms that digital banking is no longer a supplementary channel but has become a core infrastructure within Indonesia’s financial system. Consequently, competition among banks is increasingly shaped not only by product portfolios but also by how effectively digital platforms deliver a seamless and reliable user experience, which directly influences customer evaluation and continued usage.
This competitive pressure is evident in the performance of leading digital banks, such as Bank Jago. Bank Jago’s successful digital transformation is reflected in its financial performance, particularly in terms of asset growth. As shown in Table 1, Bank Jago recorded total assets of IDR 21.29 trillion in 2023, an increase of 25.52% from the previous year.
Figure 1.Growth of digital economy transactions in Indonesia, 2018–2024 (Google, Temasek, & Bain & Company (2024), e-Conomy SEA 2024.)
| Bank Name | Asset 2023(trillion) | Asset 2022(trillion) | year-on-year(yoy) |
|---|---|---|---|
| SeaBank | Rp28.23 | Rp28.26 | -0.13% |
| Bank Jago | Rp21.29 | Rp16.96 | 25.52% |
| BNC | Rp18.16 | Rp19.69 | -7.74% |
| Hibank | Rp14.59 | Rp11.58 | 25.96% |
| BCA Digital | Rp13.50 | Rp11.05 | 22.18% |
| Allo Bank | Rp12.75 | Rp11.05 | 15.29% |
| Bank Raya | Rp12.44 | Rp13.89 | 10.49% |
This growth indicates that Bank Jago has been effective in executing its digital strategy, including feature innovation tailored to market demand, particularly among Muslim consumers. Amid uneven growth across the digital banking industry, this performance affirms Bank Jago’s ability to sustain and expand its position in Indonesia’s digital financial ecosystem (Khuan, 2022). However, strong asset growth and market expansion do not automatically imply that users experience consistently high service quality, trust, satisfaction, or loyalty, particularly in highly substitutable mobile banking markets, where switching costs are low and user expectations continue to rise.
Importantly, digital transformation in banking is not limited to conventional banking institutions. Islamic banking is also rapidly developing digital services and mobile banking to support financial inclusion (Safitri et al., 2024). Data from the Financial Services Authority (O.J.K., 2024) show that digital Islamic banking transactions reached IDR 4.5 trillion in 2024 and are projected to surpass IDR 10 trillion in 2025, driven by rising Islamic financial literacy and increasingly widespread access to digital services (Bagas, 2024). These trends suggest that Islamic banking is increasingly competing to offer services comparable to conventional banking (B.S.I., 2024). Nevertheless, Islamic digital banking faces a distinct dual challenge: it must ensure Sharia compliance while simultaneously meeting modern expectations of usability, security, personalization, and service responsiveness. This implies that competitive advantage in Islamic digital banking is likely to depend not only on growth metrics but also on how well the digital service experience translates into customer satisfaction and sustained loyalty.
Bank Jago, through the launch of Jago Syariah in 2022, represents a prominent example of Islamic digital banking innovation in Indonesia. Instead of focusing on institutional transformation, Jago Syariah is positioned as a mobile-based Islamic banking service targeting younger, digitally literate consumers. This innovation balances financial services with users’ daily lifestyles by emphasizing features such as flexible account “pockets” and integration within a broader digital ecosystem. The rapid customer growth, dominated by individuals aged 18–44, suggests strong market acceptance among Generations Y and Z (Handoyo, 2024).
As competition in digital Islamic banking intensifies, User Experience (UX) is developed as a critical determinant of customer outcomes. UX includes the overall perceptions, emotions, and responses users experience when interacting with a digital product or service (Luther et al., 2020). Previous research shows that a well-designed UX positively influences Customer Satisfaction and Loyalty through repeat usage and positive word-of-mouth (Miryanda, 2023)(Obafemi et al., 2022). In mobile banking contexts, poor usability or service friction can quickly lead to customer dissatisfaction and switching behavior, specifically among younger users with high digital literacy.
Understanding the role of UX in shaping satisfaction and loyalty is particularly relevant for Islamic mobile banking services such as Jago Syariah. This research focuses on the Jabodetabek region, Indonesia’s largest metropolitan area, characterized by high internet penetration, advanced digital infrastructure, and a dominant population of Generations Y and Z (BPS 2024; APJII 2024). The region provides an appropriate setting to examine user perceptions and behavioral responses toward Islamic mobile banking applications. This research is titled “The Effect of User Experience on Customer Satisfaction and Loyalty among Generations Y and Z in the Use of Jago Syariah Mobile Banking in Jabodetabek.”
2. Literature Review
2.1 Expectation Confirmation Model (ECM)
The ECM extends the Expectation Confirmation Theory (ECT) proposed by (Oliver, 1980) which explains customer satisfaction due to the comparison between initial expectations and perceived performance of a product or service. Positive confirmation occurs and leads to higher satisfaction when perceived performance meets or exceeds expectations. Conversely, unmet expectations generate negative confirmation and lower satisfaction (Oliver, 1980).
(Bhattacherjee, 2001) adapted the framework to the context of information systems and digital technologies by retaining the core constructs of expectation, perceived performance, confirmation, and satisfaction, while introducing continuance intention as a post-adoption behavioral outcome. Therefore, ECM focuses on users’ evaluative processes after actual system use and explains the continuation of using a digital service over time.
Figure 2.Expectation-Confirmation Model (ECM) (Bhattacherjee (2001); Lai et al. (2016))
In digital service contexts, particularly mobile banking, perceived performance is not determined by functional outcomes but is strongly shaped by User Experience (UX). UX influences the perception of system usability, efficiency, reliability, and overall interaction quality, which collectively form the assessment of performance. A well-designed UX enhances users’ perceptions that the system performs as expected or better, increasing positive confirmation and satisfaction. Conversely, poor UX, such as complex navigation, slow response, or unclear features, can lead to negative performance evaluations even when the core functionality is adequate. In the ECM framework, UX acts as a critical antecedent to perceived performance and confirmation, influencing satisfaction and continuance intention in digital banking services (Bhattacherjee, 2001). The relationships among these variables are schematically shown in Figure 2.
2.2 User Experience (UX)
User Experience (UX) refers to users’ overall perceptions, evaluations, and responses resulting from interaction with a product, system, or service. The concept was introduced by Don Norman in the early 1990s to emphasize a holistic perspective on user interaction that extended beyond interface usability to include emotional, cognitive, and experiential dimensions (Norman, 2013). UX has become a central focus in digital product and service development, where sustained user engagement, efficiency, and satisfaction are critical due to the evolution of digital technologies and interactive systems (Delgado, 2022); (Narayana, 2021).
ISO 9241-210 defines UX as “a person’s perceptions and responses obtained from the anticipated use of a product, system, or service.” This definition shows the subjective and dynamic nature of UX, which is shaped by previous expectations as well as actual interaction experiences (Lecossier et al., 2018). Therefore, UX includes both functional aspects, such as usability and efficiency, and affective dimensions, namely emotions, preferences, and overall satisfaction throughout the interaction process.
This research adopts the User Experience Questionnaire (UEQ) developed by (Schrepp et al., 2017) to operationalize UX measurement in digital service research. UEQ is widely used in empirical UX research because the concept provides a comprehensive and efficient measurement of pragmatic and hedonic dimensions of user experience. The instrument consists of Attractiveness, Perspicuity, Efficiency, Dependability, Stimulation, and Novelty scales, which are grouped into two higher-order constructs, namely Pragmatic and Hedonic Quality (Schrepp, 2019). UEQ is particularly suitable for evaluating mobile banking applications since the variable captures task-oriented performance and usability as well as users’ emotional responses and perceived innovativeness. The standardized structure and proven reliability make UEQ an appropriate methodological choice for assessing UX and the influence on customer satisfaction and loyalty in digital banking contexts.
2.3 Customer Satisfaction
Customer satisfaction and loyalty are closely interconnected constructs that play a central role in explaining user behavior in digital services. Customer satisfaction reflects users’ cognitive and emotional evaluations formed after interacting with a product or service, resulting from a comparison between prior expectations and perceived performance (Oliver 1980; (Kotler & Armstrong, 2008)). Positive confirmation occurs when perceived performance meets or exceeds expectations, leading to satisfaction. Conversely, unmet expectations generate dissatisfaction. This evaluative mechanism, formalized in ECT, has been widely applied in service, e-commerce, and information systems research.
In digital contexts, satisfaction functions as a key antecedent of customer loyalty, which is commonly manifested through continuance usage intention and recommendation intention. Satisfied users repeatedly use a digital service, maintain long-term relationships with the provider, and recommend the service to others through positive word-of-mouth (Miller, 2015);(Miryanda, 2023). In mobile and digital banking, where switching costs are relatively low, loyalty is primarily behavioral and attitudinal. This is reflected in sustained usage and advocacy rather than contractual commitment. Therefore, understanding customer satisfaction as a mediator between perceived performance and loyalty is essential for explaining continued adoption and competitive advantage in digital banking services.
2.4 Customer Loyalty
Customer loyalty is a complex construct that reflects commitment to a brand or service, often manifested through repeated purchase behavior (Azhakarraja, 2020). Even though the critical role in marketing strategy is widely recognized, a universally accepted definition remains in dispute. Empirical research shows that loyalty is closely connected to customer satisfaction with a product or service, which drives repeat purchases (Miryanda, 2023). Loyalty is a key determinant of stable, long-term revenue, making the variable a central focus of contemporary marketing practices (Kirillova & Zyk, 2023).
Several factors determine customer loyalty, including service quality. High service quality significantly impacts loyalty since satisfied customers can repurchase the same product (Susilawati et al., 2024). Price and location also play important roles. Competitive pricing and strategic locations increase customer convenience and promote brand loyalty (Arizal et al., 2018). Beyond service and price, customer trust and satisfaction also contribute to loyalty. Customers who trust a brand and are satisfied with the experiences are more inclined to remain loyal and engage in repeat purchases (Lubis & Parhusip, 2023). According to (Kotler & Armstrong, 2008), customer loyalty can be gauged using three primary indicators, namely (i) repurchase intention, (ii) willingness to recommend (positive word-of-mouth/advocacy), and (iii) resistance to switching (attitudinal commitment).
a. Repeat
This describes the customers’ propensity to repurchase the same product or service. The indicator reflects the degree of customer satisfaction and perceived value derived from a product or service (Yanti et al., 2023). Firms commonly monitor purchase frequency to assess loyalty levels. The higher the rate of repeat purchases, the stronger the customer’s loyalty to the brand.
b. Retention
Customer retention is an important measure of loyalty. Retention refers to the percentage of customers who continue to use a service or engage with a brand over a given period of time. High retention rates signal the success of loyalty strategies and customer satisfaction, contributing to long-term business profitability (Kolbushkin & Cherpak, 2021). Research shows that retaining existing customers is more cost-effective than acquiring new ones, underscoring the need for effective retention strategies (Carmen-Maria & Alexandrina, 2013).
c. Referral
This occurs when a brand is referred to prospective new customers. Referrals reflect customer satisfaction and also serve as a powerful marketing strategy. Recommendations from existing customers are often trusted more than traditional advertising and can support new acquisitions at a lower cost (Saleky et al., 2018). Many brands provide incentives to customers who make referrals, which increases engagement and loyalty to the brand.
2.5 Mobile Banking
Mobile banking (M-Banking) is a banking service that enables customers to conduct a range of financial transactions through mobile devices, such as smartphones (Aslam et al., 2025). This service provides access to banking features, enhancing convenience and efficiency in financial management. Due to the ease of access, the concept has become a practical solution for highly mobile customers (Wulandari & Aisah, 2022). Core functionalities typically include fund transfers, bill payments, and account management, all of which are accessible through mobile applications. These services are designed to meet the needs of busy customers who prioritize speed and convenience (Assensoh-Kodua, 2025). The adoption of mobile banking depends on the perceived benefits and external factors such as technology anxiety, user preferences, and cultural contexts. Security, ease of use, and customer trust are key determinants of individuals’ willingness to use the services. Users’ experiences with mobile banking are positive. However, concerns persist regarding data security and fraud risks, including smishing (Wulandari & Aisah, 2022). Continuous enhancements to mobile banking features (interface design), system quality and security systems are required to strengthen perceived safety and transparency, encourage broader adoption and continued usage, and ultimately sustain long-term customer loyalty (Zhou et al., 2021).
2.6 Jago Syariah Bank
According to Bank Jago (2024), the company was originally established as PT Bank Artos Indonesia on December 14, 1992, and became publicly listed in 2016 under the ticker symbol ARTO. A major transformation occurred in December 2019, when PT Metamorfosis Ekosistem Indonesia (MEI) and PT Wealth Track Technology Limited (WTTL) acquired a combined 51% stake in Bank Artos. Subsequently, the bank changed its name to Bank Jago on June 11, 2020. This strategic step signaled a shift in the corporate focus toward technology-driven digital banking services. As part of the vertical expansion and commitment to value-based financial inclusion, Jago Syariah was launched in 2022 as a personal finance application grounded in Islamic principles (Jago, 2022).
2.7 Generation Y and Z
Generation Y, commonly referred to as Millennials, comprises individuals born between 1981 and 1996. This cohort is highly adaptable to technological changes and tends to prioritize flexibility in the workplace, having come of age amid rapid advances in information and communication technologies. Millennials are also known for pronounced entrepreneurial orientation and strong commitment to inclusivity (Tschantz, 2016). Generation Z, born between 1997 and 2012, is the first cohort to have grown up entirely in the digital era. Members of this generation are adept at using a wide range of technologies and have extensive access to information from an early age. These individuals are more independent, creative, and critical in thinking. In addition, increased social and environmental awareness is exhibited, and brand engagement is carried out through digital platforms (Prasanna & Priyanka, 2024).
3. Methods
This research used a quantitative design with a descriptive statistical method to examine the relationships between User Experience (UX), Customer Satisfaction (CS), and Customer Loyalty (CL) among users of the Jago Syariah mobile banking application. Data were collected through an online questionnaire administered using Google Forms during May–June 2025 in the Greater Jakarta area (Jakarta, Bogor, Depok, Tangerang, and Bekasi). This research population consisted of Generations Y and Z (aged 17–44) who actively used Jago Syariah mobile banking in Jabodetabek, from which 203 valid responses were obtained, satisfying the minimum sample size requirements for Partial Least Squares Structural Equation Modeling (PLS-SEM) given the 40 measurement indicators (Hair et al., 2021). Respondents were selected using a non-probability purposive sampling based on predefined criteria, including active usage of Jago Syariah, age eligibility, and residence in Jabodetabek.
The measurement instruments used a 4-point even-numbered Likert scale ranging from “strongly disagree” to “strongly agree,” which was intentionally selected to reduce central tendency bias and enable respondents to express a clear evaluative position, particularly appropriate in UX research. In this context, respondents had prior experience with the evaluated system. UX was measured using 26 indicators adapted from the UEQ (Schrepp et al., 2017). Customer Satisfaction and Loyalty were measured using 8 (Zeithaml & Bitner, 2003) and 6 indicators (Kotler & Keller, 2008), respectively. In this context, UX was specified as the exogenous construct, while Customer Satisfaction and Loyalty were reported as endogenous constructs. Data analysis was conducted in two stages, namely descriptive statistical analysis and structural equation modeling using Microsoft Excel and SmartPLS 4, respectively. The SmartPLS 4 comprised evaluation of the measurement model (indicator loadings, Average Variance Extracted (AVE), and composite reliability (CR)) and the structural model (R², f², t-statistics, and p-values). This research was subjected to methodological limitations, including reliance on self-reported data, the absence of a neutral response option due to the even-numbered Likert scale, and the use of non-probability sampling, which limited the generalizability of the results beyond the Jabodetabek region and introduced potential response and common method biases.
4. Result and Discussion
4.1 Respondent Characteristics
The survey was completed by 209 respondents; however, six respondents living outside Jabodetabek were excluded because the study specifically focused on Jabodetabek. The final sample consisted of 203 respondents, all of whom were active Jago Syariah users. The analysis covered demographics, education, occupation, income, usage patterns and motivations, the most frequently used transaction types, and reasons for infrequent use.
Most respondents were female (73.4%) and dominated by the 17–28 age group (Generation Z, 62.6%), followed by those aged 29–44 (37.4%). In terms of domicile, most lived in Jakarta and Bogor (45.4%), followed by Tangerang (22.1%), Depok (20.7%), and Bekasi (11.8%). Educational attainment was largely senior/vocational high school (44.3%), bachelor’s degree (36.5%), and diploma (15.3%). The largest occupational group was employees in state-owned/local government-owned enterprises and the private sector (39.4%), followed by students (17.2%) and entrepreneurs (16.3%). Most respondents earned IDR 5–10 million per month (40.4%), followed by < IDR 5 million (23.6%) and IDR 10–15 million (22.7%). Most had used the app for 3 months to 1 year (52.7%), while 34% had used it for more than one year; usage was relatively active, mainly 3–4 times per week (36.9%) and 1–2 times per week (31%).
The main reasons for using Jago Syariah were zero or lower administrative/transaction fees (30.5%), an easy-to-use and attractive app (20.2%), and promotions (7.9%); some users were also influenced by Sharia values (9.4%) and peers/relatives (9.9%). The most frequently used transactions were interbank transfers (26.6%) and e-wallet top-ups (21.7%), followed by the Pockets feature (10.3%), bill payments, mobile credit top-ups, and zakat/donation transactions. Reasons for infrequent use included prior technical issues (16.3%), no need for online transactions (14.8%), perceptions of insufficient features (13.3%), and a slow or error-prone app (11.3%). Overall, the user profile reflects a digitally active, productive-age cohort that values efficiency and is beginning to integrate Sharia principles into personal financial management; therefore, improving features, technical reliability, and user experience is essential to strengthen loyalty.
4.2 Validity and Reliability Tests (Outer Model)
4.2.1 Convergent Validity
Convergent validity analysis assesses the extent to which indicators adequately represent the underlying constructs. The test examines the validity of the relationships between the indicators and the latent variables. Convergent validity is evaluated using the AVE for all items associated with a given construct. AVE is computed as the mean of the squared standardized loadings of the construct’s indicators. In addition, convergent validity can be assessed using the outer loadings of the indicators.
All indicators in the model have factor loadings above 0.50, showing that the criterion for convergent validity is met and is appropriate for retention in the model(Hair et al., 2021). The User Experience (UX) construct comprises six dimensions with a total of 26 indicators (UX11 to UX64). The outer loadings of the UX indicators ranged from 0.631 to 0.842. Most indicators exceeded 0.70, showing good validity. Meanwhile, several indicators fell within the 0.60–0.70 band, which remained acceptable for exploratory research. For Customer Satisfaction and Loyalty constructs, with eight and six indicators, all outer loadings ranged from 0.705 to 0.860 and 0.760 to 0.885, respectively, showing strong and very strong indicator validities.
The indicators in the model were valid and did not need to be eliminated. The model is suitable for proceeding to reliability testing and discriminant validity assessment. The structural relationships show that User Experience exerts a strong effect on Customer Satisfaction (coefficient = 0.817) and Loyalty (0.498). Furthermore, Customer Satisfaction also exerts a strong effect on Customer Loyalty (0.443). These results support the mediating role of customer satisfaction in shaping loyalty through the user experience. Subsequent analysis examined the AVE values, as reported in Table 2. Based on Table 2, all AVE values exceeded 0.50, showing that each construct adequately represents the research model.
4.2.2 Discriminant Validity
In PLS-SEM, discriminant validity is assessed based on each construct’s ability to be empirically distinct from other constructs. In this study, discriminant validity was evaluated using the Fornell–Larcker criterion and the HTMT (Heterotrait–Monotrait Ratio).
a. Fornell-Lacker Criterion
The Fornell–Larcker criterion was applied to assess discriminant validity. Under this criterion, discriminant validity was established by comparing the square root of each construct’s AVE with the correlations of other constructs. A measurement model showed adequate discriminant validity when the square root of a construct’s AVE exceeded the inter-construct correlations (Hair et al., 2021).
As shown in Table 3, the square roots of the AVE (diagonal entries) exceed the inter-construct correlations (off-diagonal entries). The constructs satisfied discriminant validity and were valid for subsequent analysis. In addition to the Fornell–Larcker test, discriminant validity can be assessed using cross-loadings. An indicator is deemed to satisfy discriminant validity when the loading on the construct is the highest compared to others (Hair et al., 2021).
b. Heterotrait–Monotrait Ratio (HTMT)
(Henseler et al., 2015) proposed the heterotrait–monotrait ratio (HTMT) of correlations to assess discriminant validity. The HTMT is the ratio of between-trait to within-trait correlations. Formally, this ratio is the mean of all correlations among indicators across constructs with different measurements relative to the mean of the average. HTMT approximates the true correlation between two constructs when both are measured without error. True or disattenuated correlation, approaching 1, shows a lack of discriminant validity. As shown in Table 4, HTMT values were below 0.90. The constructs satisfied discriminant validity and were empirically distinct.
| Latent Variables | AVE |
|---|---|
| User Experience (UX) | 0.533 |
| Customer Satisfaction (CS) | 0.633 |
| Customer Loyalty (CL) | 0.723 |
| Latent Variables | CL | CS | UX |
|---|---|---|---|
| CL | 0.850 | ||
| CS | 0.750 | 0.796 | |
| UX | 0.760 | 0.781 | 0.873 |
| Hubungan Variabel | HTMT |
|---|---|
| Customer Satisfaction -> Customer Loyalty | 0.823 |
| User experience -> Customer Loyalty | 0.808 |
| User experience -> Customer Satisfaction | 0.859 |
| Variabel | Cronbach’s Alpha | CR (rho_c) |
|---|---|---|
| CL | 0.923 | 0.940 |
| CS | 0.917 | 0.932 |
| UX | 0.965 | 0.967 |
| Variabel | R-Square | R-Square Adjusted |
|---|---|---|
| Customer Loyalty (CL) | 0.805 | 0.803 |
| Customer Satisfaction (CS) | 0.667 | 0.665 |
4.2.3 Composite Reliability (CR)
Reliability reflects the accuracy, consistency, and precision of a measurement tool (Hair et al., 2021). Research showing reliability has dependable data and consistent results. In PLS, reliability can be assessed using two metrics, namely Cronbach’s alpha and CR. Table 5 shows the results of the reliability assessment as follows. The constructs are declared reliable because the Cronbach’s alpha and CR values are above 0.60 and 0.70, respectively (Hair et al., 2021).
4.3 Structural Model Evaluation (Inner Model)
4.3.1 Coefficient of Determination Test (R²)
The Structural Model (Inner Model) was tested after the estimated model met the criteria of the Outer Model. The R-squared (R²) values for the constructs in this research are as follows.
Based on Table 6, the adjusted R-squared value for Customer Loyalty is 0.803, indicating a strong model fit. This result suggests that User Experience and Customer Satisfaction explain 80.3% of the variance in Customer Loyalty. In addition, Customer Satisfaction has an adjusted R-squared value of 0.665, which also indicates a strong model fit, meaning that 66.5% of the variance in Customer Satisfaction is explained by the independent variables.
4.4 F-Square Test
The F-square test is conducted to determine the relative effect size of the independent latent variables on the dependent latent variables. According to Hair et al. (2021), the criteria for measuring the F-squares are as follows.
- An f² value of 0.35 shows that the independent latent variables exert a large effect on the dependent latent variable.
- An f² value of 0.15 shows that the independent latent variables have a medium (moderate) effect on the dependent latent variable.
- An f² value of 0.02 suggests that the independent latent variables have a small effect on the dependent latent variable.
The F-square values for the Customer Loyalty variable are 0.336 and 0.424 (Table 7). Therefore, the independent variables influencing Customer Loyalty have a strong effect. The F-square value for Customer Satisfaction was 2.002 since the independent variables have a strong effect.
4.5 T-test of Significance
Calculations were performed using the dimensions of the validated variables to determine the significance of the parameter coefficients. This research ascertained the positive and negative effects, as well as the level of significance based on p-values below 0.05 and t-statistics greater than or equal to 1.96 (Hair et al., 2021). The relationship between the two constructs was deemed significant when the t-statistic exceeded the t-table value (1.96). Based on Table 8, the bootstrap analysis results of the latent variabels are as follows.
| Hubungan Variabel | HTMT |
|---|---|
| Customer Satisfaction -> Customer Loyalty | 0.336 |
| User experience -> Customer Loyalty | 0.424 |
| User experience -> Customer Satisfaction | 2.002 |
Figure 3.Bootstrap analysis test result of the latent variables
| Original Sample (O) | T Statistics (O/STDEV) | P-Values | |
|---|---|---|---|
| Customer Satisfaction -> Customer Loyalty | 0.443 | 5.529 | 0.000 |
| User experience -> Customer Loyalty | 0.498 | 6.716 | 0.000 |
| User experience -> Customer Satisfaction | 0.817 | 21.176 | 0.000 |
- Effect of User Experience on Customer SatisfactionThe original sample estimate for the effect of User Experience on Customer Satisfaction is positive, namely 0.817. The t-statistic is 21.176 > 1.96 (Hair et al., 2021), showing that the relationship is significant. Therefore, User Experience has a positive and significant effect on Customer Satisfaction. This result is consistent with Rezaldi (2018), where User Experience dimensions such as attractiveness, efficiency, dependability, stimulation, and novelty significantly influence customer satisfaction. This research confirms that a positive user experience generates a sense of satisfaction with digital services, particularly among Generations Y and Z, who have high expectations of application performance and convenience.
- Effect of User Experience on Customer LoyaltyThe original sample estimate for the effect of User Experience on Customer Loyalty is positive at 0.498. The t-statistic is 6.716 > 1.96 (Hair et al., 2021), showing a significant relationship. Thus, User Experience has a positive and significant effect on Customer Loyalty. This result is consistent with Pamungkas (2013), where a strong user experience can significantly enhance customer loyalty. In the context of digital banking, loyalty is evidenced by repeated usage and the likelihood of recommending the service to others.
- Effect of Customer Satisfaction on Customer LoyaltyThe original sample estimate for the effect of Customer Satisfaction on Loyalty is 0.443, with a t-statistic of 5.529 > 1.96 (Hair et al., 2021), showing a significant effect. Therefore, Customer Satisfaction has a positive and significant effect on Loyalty. This research reinforces the results of Constantin (2012), where satisfied customers tend to exhibit higher levels of loyalty because of the reluctance to take the risk of trying a new service. In the context of Jago Syariah, positive experiences contribute directly to the intention of using the application and recommending the service to others, creating a network effect for the sustainability of Sharia digital banking services.
5. Conclusion
In conclusion, the users of Jago Syariah mobile banking were predominantly from Generations Y and Z residing in the Jabodetabek area. Most respondents were active users who regularly used mobile banking for daily financial transactions, particularly for fund transfers and balance inquiries. The majority of these individuals had attained a diploma or bachelor’s degree (D3/S1), and represented diverse occupational and income backgrounds. The results showed that User Experience (UX) had a significant influence on Customer Satisfaction and Loyalty. Therefore, a more positive user experience led to higher levels of satisfaction and loyalty toward Jago Syariah mobile banking services. Customer Satisfaction was found to have a significant effect on Loyalty, suggesting that satisfied users were expected to continue using the service and recommend the application to others.
Conflict of Interest
The authors declare no conflict of interest.
References
- News Antara. Transaksi perbankan digital 2024 tumbuh pesat [Internet. 2024. Publisher Full Text
- A.P.J.I.I.. Penetrasi internet Indonesia 2024 [Internet. 2024. Publisher Full Text
- Archer A., Wildman N..In: Fleuren H., Sitskoorn M., Wilthagen T.. The New Common: How the COVID-19 Pandemic Is Transforming Society. Aarts E. Open Press Tilburg University: Open Press Tilburg University; 2020:29-33. DOI
- Arizal N., Listihana D.W., Nofrizal N.. The effect of marketing mix on satisfaction and its impact on hotel customer loyalty in Pekanbaru-Riau. Advances in Economics, Business and Management Research. 2018; 57
- Aslam M., Zain F., Shaheer S.A., Zahir S.. Unlocking mobile banking adoption: The interplay of interface design, system quality, service quality, security, and customer involvement. The Critical Review of Social Sciences Studies. 2025; 3(1):251-274. DOI
- Assensoh-Kodua A.. Mobile banking: The change agent of the fintech industry through a multidimensional concept. 2025.
- Azhakarraja C.. An overview of customer relationship management. CLEAR International Journal of Research in Commerce & Management. 2020; 11(12)
- Bagas Fasa M.I.. Transformasi digital era industri 4.0: Revolusi layanan yang mengubah lanskap perbankan syariah di Indonesia. Jurnal Intelek dan Cendikiawan Nusantara. 2024; 1(5):7653-7665.
- Jago Bank. Bank Jago luncurkan aplikasi perbankan khusus segmen syariah [Internet. 2022.
- Jago Bank. Integrated annual report 2023. 2024.
- Bhattacherjee A.. Understanding information systems continuance: An expectation-confirmation model. MIS Quarterly. 2001; 25(3):351-370. DOI
- Indonesia B.P.S.Agama. 2024. Publisher Full Text
- B.S.I.. Kinerja keuangan moncer, BSI cetak pertumbuhan laba 20,28%. 2024.
- Carmen-Maria I., Alexandrina S.. Customer loyalty - The guaranteed success of an organization on the market. Strategii Manageriale. 2013; 4(11):41-48.
- Constantin A.M.. The antecedent of e-satisfaction and e-loyalty and the relationship between them. Timisoara Journal of Economics. 2012; 5(18):236-252.
- Delgado. User experience (UX) in metaverse: Realities and challenges. Metaverse: Basic and Applied Research. 2022; 1(9):1-4. DOI
- Google Temasek, Bain, SEA Company. Perekonomian digital Indonesia akan mencapai GMV USD 90 miliar pada tahun 2024 [Internet. 2024. Publisher Full Text
- Hair J.F., Hult G.T.M., Ringle C.M., Sarstedt M., Danks N.P.. Springer: Cham; 2021. DOI
- Handoyo. Terus perluas jangkauan, Bank Jago catat jumlah nasabah segmen syariah capai 1,8 juta [Internet. 2024. Publisher Full Text
- Henseler J., Ringle C.M., Sarstedt M.. A new criterion for assessing discriminant validity in variance-based structural equation modeling. Journal of the Academy of Marketing Science. 2015; 43(1):115-135. DOI
- Khuan H.. Analysis of competitiveness for market share expansion of PT Bank Jago Tbk. JOSR: Journal of Social Research. 2022; 3(2):221-230. DOI
- Kirillova T.V., Zyk E.A.. Consumer loyalty: A critical analysis of approaches towards definition. Research Result: Business and Service Technologies. 2023; 9(2)DOI
- Kolbushkin Y., Cherpak O.. Customer loyalty management in the airline's development strategy. Problems of Systemic Approach in the Economy. 2021; 3(83)DOI
- Kotler P., Armstrong G.. Pearson Education: Upper Saddle River (NJ; 2008.
- Kotler P., Keller K.L.. Pearson Education: Amsterdam; 2008.
- Kozhushko I.. Transformation of the financial services industry in conditions of digitalization of the economy. Financial Markets, Institutions and Risks. 2023; 7(4):189-200. DOI
- Lai H.M., Chen C.P., Chang Y.F.. Expectation-confirmation model of information system continuance: A meta-analysis. International Journal of Educational and Pedagogical Sciences. 2016; 10(7):2325-2330.
- Lecossier A., Tcha-Tokey K., Richir S.. The user experience measurement: A challenge of the twenty-first century [Internet. 2018. DOI
- Lubis N., Parhusip A.. Kualitas pelayanan dan kepercayaan terhadap loyalitas pelanggan paket internet Simpati. Jurnal Studi Manajemen Fakultas Ekonomi dan Bisnis. 2023; 1(1)DOI
- Luther L., Tiberius V., Brem A.. User experience (UX) in business, management, and psychology: A bibliometric mapping of the current state of research. Multimodal Technologies and Interaction. 2020; 4(2):1-19. DOI
- Miller A.R.. Norms versus expectations in explaining consumer satisfaction. Proceedings of the Academy of Marketing Science (AMS) Annual Conference. 2015. DOI
- Miryanda A.. Pengaruh kualitas pelayanan, harga, dan lokasi terhadap keputusan pembelian. Jurnal Mahkota Bisnis. 2023; 2(1):16-31. DOI
- Narayana. Enhancing digital interfaces: A comprehensive strategy for UI/UX improvement, user engagement, and operational efficiency. International Journal of Scientific Research. 2021.
- Norman D.A.. Basic Books: New York; 2013.
- O.J.K.. Otoritas Jasa Keuangan: Jakarta; 2024.
- Obafemi O.O., Obiekwe O., Oiku O.. Impact of customer loyalty on organizational performance. IIARD International Journal of Economics and Business Management. 2022; 8(5):56-62. DOI
- Oliver R.L.. A cognitive model of the antecedents and consequences of satisfaction decisions. Journal of Marketing Research. 1980; 17(4):460-469. DOI
- Pamungkas H.H.. Pengaruh user experience terhadap loyalitas pengguna Apple iPhone (Studi kasus Kota Jakarta. 2013.
- Prasanna M., Priyanka A.L.. Marketing to Gen Z: Understanding the preferences and behaviors of the next generation. International Journal for Multidisciplinary Research. 2024; 6(4):1-8. DOI
- Rezaldi I.. Pengaruh user experience terhadap customer satisfaction pada pengguna aplikasi Iflix. 2018.
- Safitri N.A., Julia R., Swinta S., Elisah N.N., Nadya D., Hutapea A., Ariyana N.. Strategi inovasi perbankan digital dalam menghadapi persaingan industri keuangan. Indonesian Journal of Economics Management and Accounting. 2024; 1(5):414-419.
- Schrepp M.. User Experience Questionnaire Handbook Version. 2019.
- Schrepp M., Hinderks A., Thomaschewski J.. Construction of a benchmark for the User Experience Questionnaire (UEQ. International Journal of Interactive Multimedia and Artificial Intelligence. 2017; 4(4):40-44. DOI
- Saleky R.J., Cheng W.L., Payangan R., Jusni J., Pono M.. Identification of customer loyalty determinants in the service industry. Journal of Business and Management Sciences. 2018; 6(4):171-178. DOI
- Susilawati A.D., Wahyudi F., Putra W.P., Supriyanto W., Limpo L.. The impact of digital user experience on brand perception and consumer loyalty in the e-commerce industry in Indonesia. Eastasouth Journal of Information Systems and Computer Science. 2024; 1(3):109-122. DOI
- Tschantz C.A.. Increasing job satisfaction and organizational commitment in the millennial workforce [Senior Honors Thesis. 2016. Publisher Full Text
- Wulandari P., Aisah N.. Pengaruh penggunaan mobile banking terhadap kepuasan nasabah (studi kasus mahasiswa UINSU. Jurnal Ekonomi Manajemen Bisnis. 2022; 1(1):38-42. DOI
- Yanti F., Sudirman R., Rusli A.. Analisis komparatif kinerja keuangan bank syariah dan bank konvensional di masa COVID-19. JESYA: Jurnal Ekonomi dan Ekonomi Syariah. 2023; 6(2):1571-1580. DOI
- Zeithaml V., Bitner M.. McGraw-Hill Higher Education: New York; 2003.
- Zhou Q., Lim F.J., Yu H., Xu G., Ren X., Liu D., Wang X., Mai X., Xu H.. A study on factors affecting service quality and loyalty intention in mobile banking. Journal of Retailing and Consumer Services. 2021; 60(102424)DOI
References
Antara News. Transaksi perbankan digital 2024 tumbuh pesat [Internet]. 2024. [accessed 3 July 2025]. Available at: https://www.antaranews.com/infografik/4504889/transaksi-perbankan-digital-2024-tumbuh-pesat
APJII. Penetrasi internet Indonesia 2024 [Internet]. 2024. [accessed 3 July 2025]. Available at: https://apjii.or.id
Archer A, Wildman N. Internet access as an essential social good. In: The New Common: How the COVID-19 Pandemic Is Transforming Society. Aarts E, Fleuren H, Sitskoorn M, Wilthagen T (Eds.). Noord-Brabant: Open Press Tilburg University; 2020. pp. 29-33. https://doi.org/10.1007/978-3-030-65355-2_4 DOI: https://doi.org/10.1007/978-3-030-65355-2_4
Arizal N, Listihana DW, Nofrizal N. The effect of marketing mix on satisfaction and its impact on hotel customer loyalty in Pekanbaru-Riau. Advances in Economics, Business and Management Research. 2018;57.
Aslam M, Zain F, Shaheer SA, Zahir S. Unlocking mobile banking adoption: The interplay of interface design, system quality, service quality, security, and customer involvement. The Critical Review of Social Sciences Studies. 2025;3(1):251-274. https://doi.org/10.59075/myg1ac63 DOI: https://doi.org/10.59075/myg1ac63
Assensoh-Kodua A. Mobile banking: The change agent of the fintech industry through a multidimensional concept. 2025.
Azhakarraja C. An overview of customer relationship management. CLEAR International Journal of Research in Commerce & Management. 2020;11(12).
Bagas, Fasa MI. Transformasi digital era industri 4.0: Revolusi layanan yang mengubah lanskap perbankan syariah di Indonesia. Jurnal Intelek dan Cendikiawan Nusantara. 2024;1(5):7653-7665.
Bank Jago. Bank Jago luncurkan aplikasi perbankan khusus segmen syariah [Internet]. 2022.
Bank Jago. Integrated annual report 2023. 2024.
Bhattacherjee A. Understanding information systems continuance: An expectation-confirmation model. MIS Quarterly. 2001;25(3):351-370. https://doi.org/10.2307/3250921 DOI: https://doi.org/10.2307/3250921
BPS. Agama di Indonesia, 2024 [Internet]. 2024. [accessed 3 July 2025]. Available at: https://samarindakota.bps.go.id/id/statistics-table/1/MzI0IzE=/agama-di-indonesia-2024.html
BSI. Kinerja keuangan moncer, BSI cetak pertumbuhan laba 20,28%. 2024.
Carmen-Maria I, Alexandrina S. Customer loyalty - The guaranteed success of an organization on the market. Strategii Manageriale. 2013;4(11):41-48.
Constantin AM. The antecedent of e-satisfaction and e-loyalty and the relationship between them. Timisoara Journal of Economics. 2012;5(18):236-252.
Delgado. User experience (UX) in metaverse: Realities and challenges. Metaverse: Basic and Applied Research. 2022;1(9):1-4. https://doi.org/10.56294/mr20229 DOI: https://doi.org/10.56294/mr20229
Google, Temasek, Bain & Company. e-Conomy SEA 2024: Perekonomian digital Indonesia akan mencapai GMV USD 90 miliar pada tahun 2024 [Internet]. 2024. [accessed 3 July 2025]. Available at: https://economysea.withgoogle.com/
Hair JF, Hult GTM, Ringle CM, Sarstedt M, Danks NP. Partial Least Squares Structural Equation Modeling (PLS-SEM) Using R: A Workbook. Cham: Springer; 2021. https://doi.org/10.1007/978-3-030-80519-7 DOI: https://doi.org/10.1007/978-3-030-80519-7
Handoyo. Terus perluas jangkauan, Bank Jago catat jumlah nasabah segmen syariah capai 1,8 juta [Internet]. 2024. [accessed 3 July 2025]. Available at: https://keuangan.kontan.co.id/news/terus-perluas-jangkauan-bank-jago-catat-jumlah-nasabah-segmen-syariah-capai-18-juta
Henseler J, Ringle CM, Sarstedt M. A new criterion for assessing discriminant validity in variance-based structural equation modeling. Journal of the Academy of Marketing Science. 2015;43(1):115-135. https://doi.org/10.1007/s11747-014-0403-8 DOI: https://doi.org/10.1007/s11747-014-0403-8
Khuan H. Analysis of competitiveness for market share expansion of PT Bank Jago Tbk. JOSR: Journal of Social Research. 2022;3(2):221-230. https://doi.org/10.55324/josr.v1i3.57 DOI: https://doi.org/10.55324/josr.v1i3.57
Kirillova TV, Zyk EA. Consumer loyalty: A critical analysis of approaches towards definition. Research Result: Business and Service Technologies. 2023;9(2). https://doi.org/10.18413/2408-9346-2023-9-2-0-7 DOI: https://doi.org/10.18413/2408-9346-2023-9-2-0-7
Kolbushkin Y, Cherpak O. Customer loyalty management in the airline's development strategy. Problems of Systemic Approach in the Economy. 2021;3(83). https://doi.org/10.32782/2520-2200/2021-3-12 DOI: https://doi.org/10.32782/2520-2200/2021-3-12
Kotler P, Armstrong G. Principles of Marketing. 12th ed. Upper Saddle River (NJ): Pearson Education; 2008.
Kotler P, Keller KL. Marketing Management: De Essentie. Amsterdam: Pearson Education; 2008.
Kozhushko I. Transformation of the financial services industry in conditions of digitalization of the economy. Financial Markets, Institutions and Risks. 2023;7(4):189-200. https://doi.org/10.61093/fmir.7(4).189-200.2023 DOI: https://doi.org/10.61093/fmir.7(4).189-200.2023
Lai HM, Chen CP, Chang YF. Expectation-confirmation model of information system continuance: A meta-analysis. International Journal of Educational and Pedagogical Sciences. 2016;10(7):2325-2330.
Lecossier A, Tcha-Tokey K, Richir S. The user experience measurement: A challenge of the twenty-first century [Internet]. 2018. [accessed 3 July 2025]. Available at: https://doi.org/10.1155/2018/7827286 DOI: https://doi.org/10.1155/2018/7827286
Lubis N, Parhusip A. Kualitas pelayanan dan kepercayaan terhadap loyalitas pelanggan paket internet Simpati. Jurnal Studi Manajemen Fakultas Ekonomi dan Bisnis. 2023;1(1). https://doi.org/10.55606/jubima.v1i1.1134 DOI: https://doi.org/10.55606/jubima.v1i1.1134
Luther L, Tiberius V, Brem A. User experience (UX) in business, management, and psychology: A bibliometric mapping of the current state of research. Multimodal Technologies and Interaction. 2020;4(2):1-19. https://doi.org/10.3390/mti4020018 DOI: https://doi.org/10.3390/mti4020018
Miller AR. Norms versus expectations in explaining consumer satisfaction. Proceedings of the Academy of Marketing Science (AMS) Annual Conference. 2015. https://doi.org/10.1007/978-3-319-17052-7_21 DOI: https://doi.org/10.1007/978-3-319-17052-7_21
Miryanda A. Pengaruh kualitas pelayanan, harga, dan lokasi terhadap keputusan pembelian. Jurnal Mahkota Bisnis. 2023;2(1):16-31. https://doi.org/10.59929/mm.v2i1.19 DOI: https://doi.org/10.59929/mm.v2i1.19
Narayana. Enhancing digital interfaces: A comprehensive strategy for UI/UX improvement, user engagement, and operational efficiency. International Journal of Scientific Research. 2021.
Norman DA. The Design of Everyday Things: Revised and Expanded Edition. New York: Basic Books; 2013.
OJK. Kinerja positif perbankan syariah 2024. Jakarta: Otoritas Jasa Keuangan; 2024.
Obafemi OO, Obiekwe O, Oiku O. Impact of customer loyalty on organizational performance. IIARD International Journal of Economics and Business Management. 2022;8(5):56-62. https://doi.org/10.56201/ijebm.v8.no5.2022.pg56.62 DOI: https://doi.org/10.56201/ijebm.v8.no5.2022.pg56.62
Oliver RL. A cognitive model of the antecedents and consequences of satisfaction decisions. Journal of Marketing Research. 1980;17(4):460-469. https://doi.org/10.1177/002224378001700405 DOI: https://doi.org/10.1177/002224378001700405
Pamungkas HH. Pengaruh user experience terhadap loyalitas pengguna Apple iPhone (Studi kasus Kota Jakarta) [Undergraduate Thesis]. Bandung: Telkom University; 2013.
Prasanna M, Priyanka AL. Marketing to Gen Z: Understanding the preferences and behaviors of the next generation. International Journal for Multidisciplinary Research. 2024;6(4):1-8. https://doi.org/10.36948/ijfmr.2024.v06i04.26612 DOI: https://doi.org/10.36948/ijfmr.2024.v06i04.26612
Rezaldi I. Pengaruh user experience terhadap customer satisfaction pada pengguna aplikasi Iflix [Undergraduate Thesis]. Bandung: Telkom University; 2018.
Safitri NA, Julia R, Swinta S, Elisah NN, Nadya D, Hutapea A, Ariyana N. Strategi inovasi perbankan digital dalam menghadapi persaingan industri keuangan. Indonesian Journal of Economics Management and Accounting. 2024;1(5):414-419.
Schrepp M. User Experience Questionnaire Handbook Version. 2019.
Schrepp M, Hinderks A, Thomaschewski J. Construction of a benchmark for the User Experience Questionnaire (UEQ). International Journal of Interactive Multimedia and Artificial Intelligence. 2017;4(4):40-44. https://doi.org/10.9781/ijimai.2017.445 DOI: https://doi.org/10.9781/ijimai.2017.445
Saleky RJ, Cheng WL, Payangan R, Jusni J, Pono M. Identification of customer loyalty determinants in the service industry. Journal of Business and Management Sciences. 2018;6(4):171-178. https://doi.org/10.12691/jbms-6-4-5 DOI: https://doi.org/10.12691/jbms-6-4-5
Susilawati AD, Wahyudi F, Putra WP, Supriyanto W, Limpo L. The impact of digital user experience on brand perception and consumer loyalty in the e-commerce industry in Indonesia. Eastasouth Journal of Information Systems and Computer Science. 2024;1(3):109-122. https://doi.org/10.58812/esiscs.v1i03.244 DOI: https://doi.org/10.58812/esiscs.v1i03.244
Tschantz CA. Increasing job satisfaction and organizational commitment in the millennial workforce [Senior Honors Thesis]. 2016. Available at: https://digitalcommons.liberty.edu/honors/574
Wulandari P, Aisah N. Pengaruh penggunaan mobile banking terhadap kepuasan nasabah (studi kasus mahasiswa UINSU). Jurnal Ekonomi Manajemen Bisnis. 2022;1(1):38-42. https://doi.org/10.47233/jemb.v1i1.435 DOI: https://doi.org/10.47233/jemb.v1i1.435
Yanti F, Sudirman R, Rusli A. Analisis komparatif kinerja keuangan bank syariah dan bank konvensional di masa COVID-19. JESYA: Jurnal Ekonomi dan Ekonomi Syariah. 2023;6(2):1571-1580. https://doi.org/10.36778/jesya.v6i2.1169 DOI: https://doi.org/10.36778/jesya.v6i2.1169
Zeithaml V, Bitner M. Services Marketing. New York: McGraw-Hill Higher Education; 2003.
Zhou Q, Lim FJ, Yu H, Xu G, Ren X, Liu D, Wang X, Mai X, Xu H. A study on factors affecting service quality and loyalty intention in mobile banking. Journal of Retailing and Consumer Services. 2021;60:102424. https://doi.org/10.1016/j.jretconser.2020.102424 DOI: https://doi.org/10.1016/j.jretconser.2020.102424
Published
Issue
Section
License
Copyright (c) 2025 Rafifah Rismawati, Mohammad iqbal Irfany

This work is licensed under a Creative Commons Attribution-ShareAlike 4.0 International License.
How to Cite